TigerFinOps
Live demo, synthetic dataWhich cloud spend is waste, and who actually owns it?
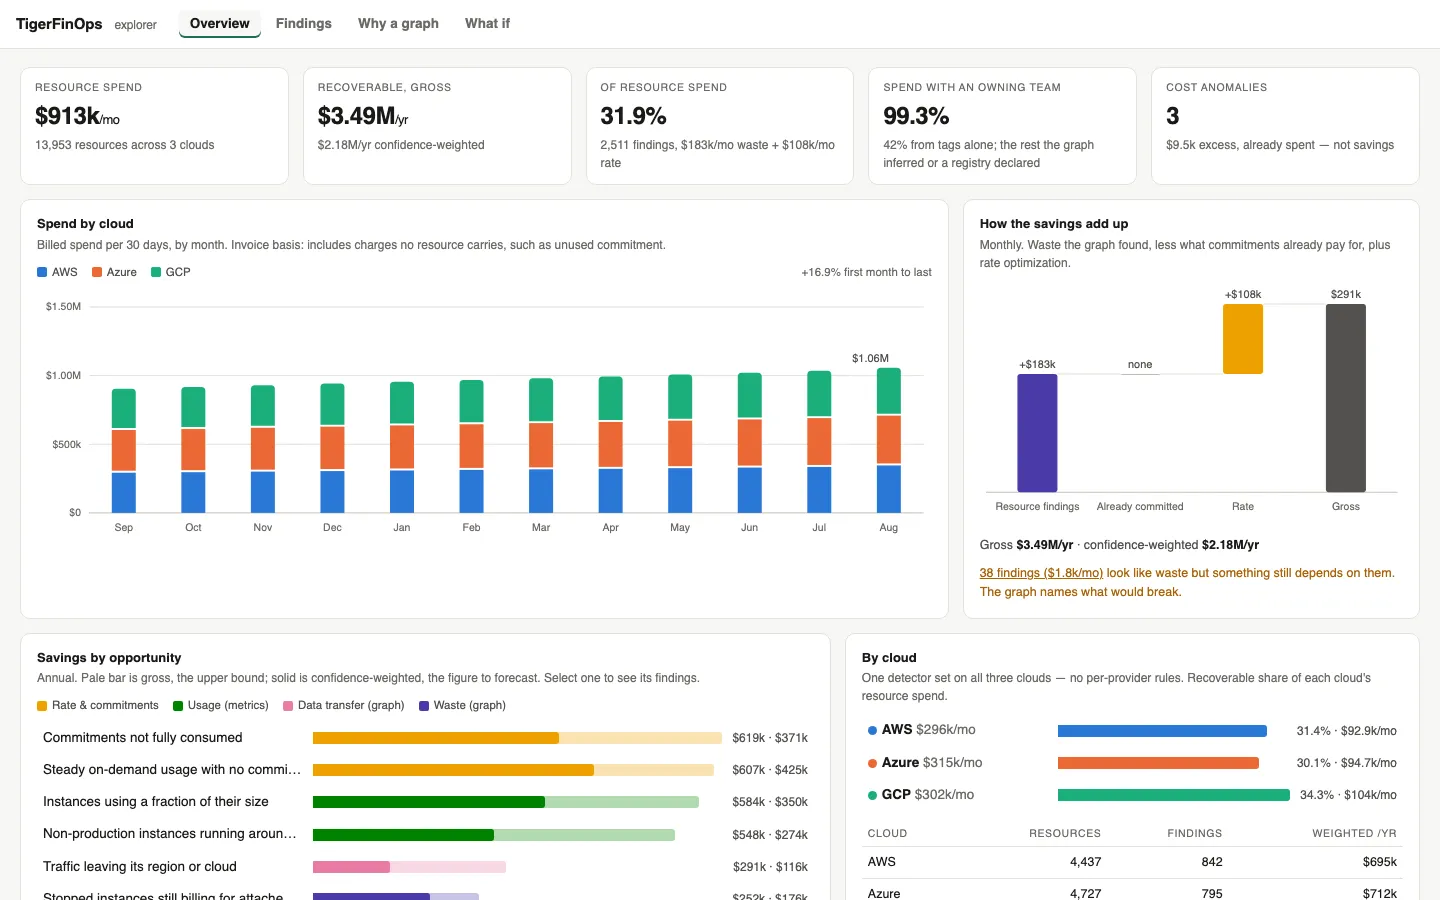
Graph-native cloud cost optimization built on FOCUS, the open billing standard. TigerFinOps joins billing data with a resource inventory into one property graph, then produces costed, auditable recommendations. The graph database is embedded, so there is no server to stand up.
What it does
- Finds what a bill cannot: a NAT gateway serving an empty subnet, a snapshot that outlived its volume, an untagged disk that belongs to payments because of what it is attached to.
- Infers ownership of untagged resources by following relationships, with a confidence score and evidence trail on every claim.
- Allocates shared infrastructure such as NAT gateways, load balancers and shared databases to the teams that actually use it.
- Explains anomalies through the graph ("8 of 8 contributing resources share one subnet") and keeps them out of savings figures.
- Covers rate and commitment optimization, rightsizing, off-hours scheduling and storage tiering alongside waste elimination.
The demo runs on a generated enterprise estate of about 13,000 resources across three clouds. Figures shown in it are synthetic.
A question, in Cypher
The NAT gateways that are billing but serve no workloads. From the TigerFinOps source.
MATCH (nat:Resource)-[:IN_SUBNET]->(s:Resource)
WHERE nat.archetype = 'nat_gateway' AND nat.monthly_cost > 0
OPTIONAL MATCH (w:Resource)-[:IN_SUBNET]->(s)
WHERE w.archetype IN ['vm', 'database']
WITH nat, s, count(w) AS workloads
WHERE workloads = 0
RETURN nat.name, s.name, nat.monthly_cost